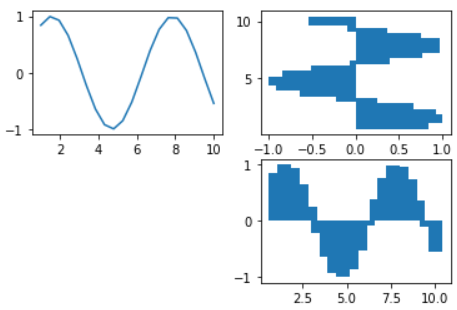
plt.subplot()
在当前图片中绘制一个子图
Add a subplot to the current figure.
此函数参数很多,这里未详细介绍,加一个例子供理解
1 | import numpy as np |
plt.subplot()
在当前图片中绘制一个子图
Add a subplot to the current figure.
此函数参数很多,这里未详细介绍,加一个例子供理解
1 | import numpy as np |
- 版权声明: 本博客所有文章除特别声明外,均采用 CC BY 4.0 CN协议 许可协议。转载请注明出处!